ATGVIDEO
Home
Hot video
Now watching
Search
News
Sport
Music
Games
Humor
Animals
Movies
Auto
Home
Joshua Emmanuel
Joshua Emmanuel
Latest Videos
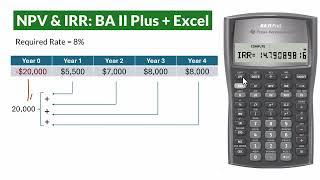
NPV & IRR Formula + TI BA II Plus + Excel – Equipment Purchase & Residual value
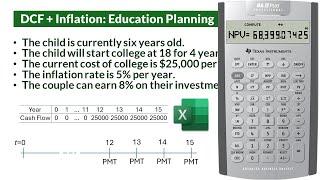
Financial Planning + Inflation- College Education investment Real Rate - BA II Plus & Excel
Select items from Vectors in R Indexing and Subsetting in R Studio A Beginners Guide
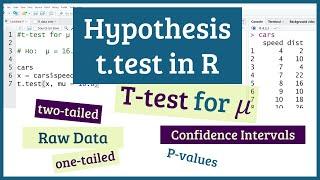
T-Tests in R Studio One Sample Mean with raw data One-Tailed & Two-Tailed
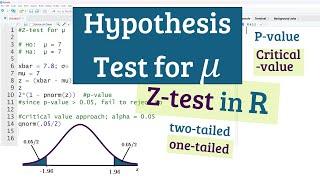
Hypothesis Z-Tests in RStudio A Step-by-Step Guide One Sample Mean-1 & 2 tailed tests
Confidence Intervals for one Population Mean in R Z & t – Summary & Raw Data
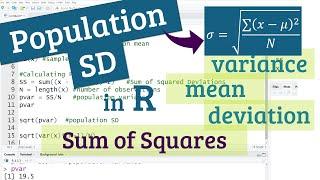
Population Standard Deviation in R - Sum of Squares Variance SD in RStudio
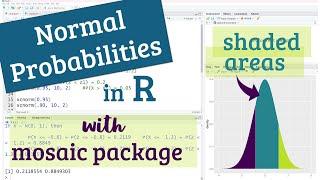
Draw Normal Curves in RStudio with shading -Calculate Probabilities & Critical Z Values
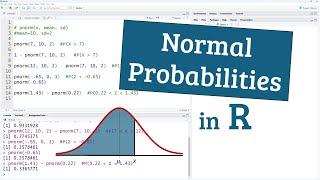
Areas under Normal Curve in R Calculating probabilities in R Studio
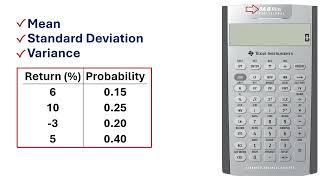
Mean Standard Deviation Variance on BA II Plus Calculator Probability Distribution x̄ SD σ²
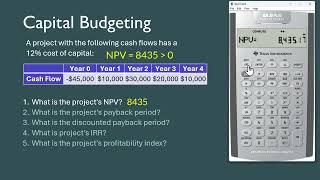
Discounted Cash Flows on BAII Plus – NPV IRR PB DPB PI - DCF - Capital Budgeting
General Annuity Problems Solved in Excel or Google Sheets – FV & PV Ordinary END & Due BGN
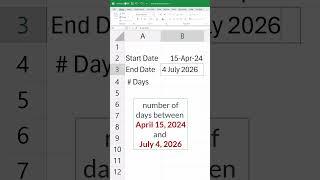
Number of Days between Dates in Excel or Google Sheets #excel #finance
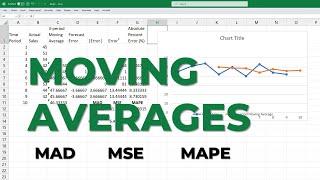
Moving Averages in Excel -MAD MAE MSE MAPE Forecast + Graph
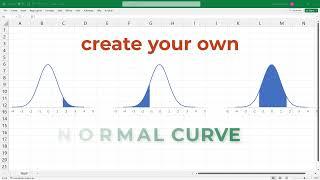
Draw Bell-Shaped Curves in Microsoft Excel and PowerPoint Normal Distribution Shade area
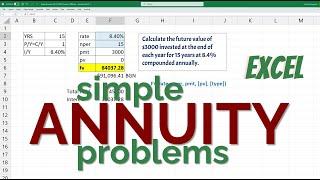
Annuity Calculations in Excel – FV PV PMT N Simple - Ordinary END & Due BGN
Solved Compound Interest Problems in Excel–Future Present Values Rate Periods Examples +Template
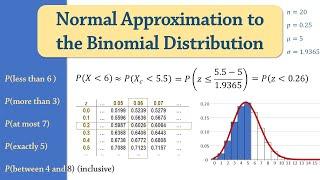
Solved Examples Normal Approximation to Binomial Distribution -Probability Continuity Correction
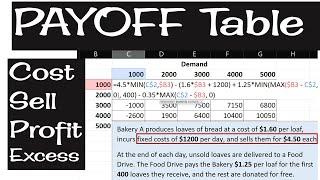
Create Payoff Table Excel Cost Selling Price Profit Shortage Excess DemandSupply
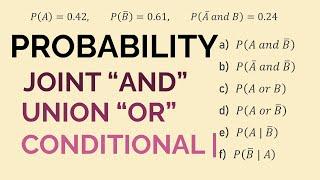
Solved -Probabilities AND OR GIVEN Joint Conditional Union + Complements
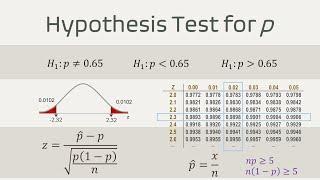
Hypothesis Test for Proportion Template in ExcelGoogle Sheets Critical & P-values
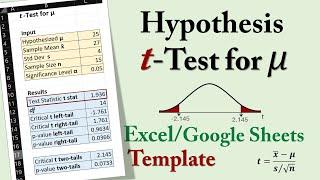
Hypothesis t-test Template for mean in ExcelGoogle Sheets Critical & P-values
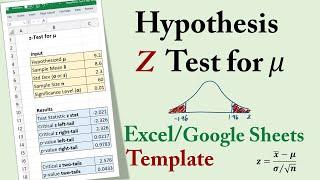
Hypothesis Z-test for mean – Excel Template Hypothesis Testing critical & p-values
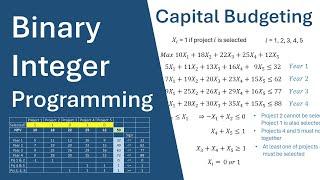
Binary Integer LP – Capital Budgeting – Formulation + Solution
Solving MathStats Problems in Microsoft Copilot - Bing Chat - Prompt Engineering basics
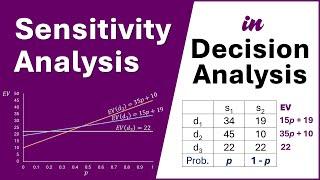
Decision Analysis - Sensitivity Analysis Find p Draw Graph Data Table in Excel
Solved - Hypothesis - Proportion Test Z test P-value First-time home buyers
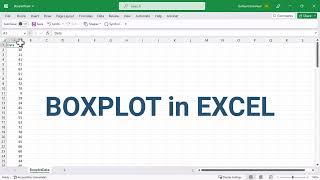
Construct Horizontal Boxplot Excel + PowerPoint to Word
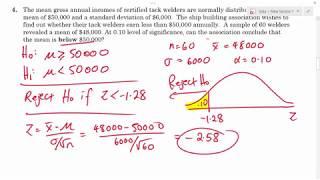
Hypothesis Testing 2-tailed Solved Problem Quiz 10#5
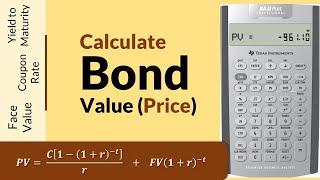
Calculating Bond Value Price Formula Excel BA II Plus calculator
Special LP Cases in Simplex Method Infeasibility Alternative Solutions Unboundedness Degeneracy
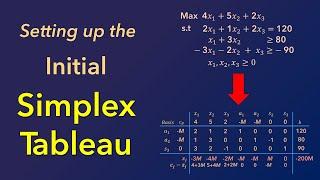
Initial Simplex Tableau setup Artificial Variables Slack Surplus Iteration 0
Paired t-test Dependent Samples Hypothesis test Confidence Interval
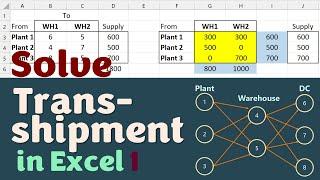
Solve Transshipment in Excel 2 - Network Flow - Shipment between any 2 nodes
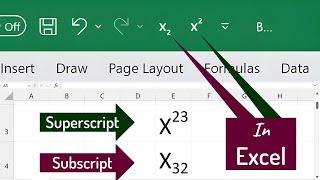
How to type Subscript & Superscript in Excel
Solve Linear Programming Graph in Desmos FREE LP Optimal solution Maximize Minimize
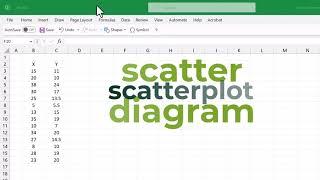
Scatterplot in Excel Scatter Diagram Residuals from Graph Slope Intercept R-Square
Histogram in Excel using Pivot Tables Frequency Distribution Quantitative raw data
Boxplots in Excel Single Side-by-side box plot
Bar chart & Pie chart in Excel – Pivot Tables – Summary & Raw Data
Chi-Square Test of Independence Contingency Table Hypothesis Test
Solve Transshipment in Excel Network Flow Plant - Warehouse - Distribution Centre
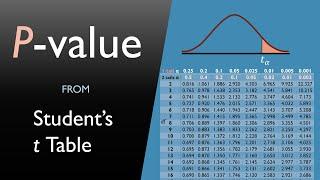
P-value from t-table How to estimate P-value without software
Hypothesis Test for Proportion Examples P-value Z table
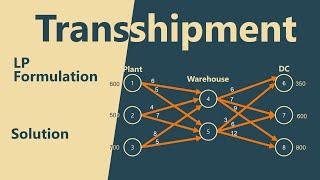
Transshipment Problem -LP Formulation Solution
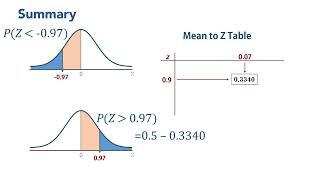
Normal Distribution Mean to Z Table How to Calculate Probabilities
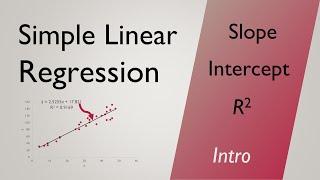
Intro to Simple Linear Regression Slope y-intercept R-square
Normal Distribution Confidence Interval Hypothesis Testing -Test Review
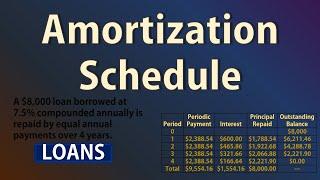
Amortization Schedule Loan Repayment Basic Intro PV PMT BAL PRN INT
BA II Plus - Store and Recall Values - Using Memory