ATGVIDEO
Home
Hot video
Now watching
Search
News
Sport
Music
Games
Humor
Animals
Movies
Auto
Home
BrunelASK
BrunelASK
Latest Videos
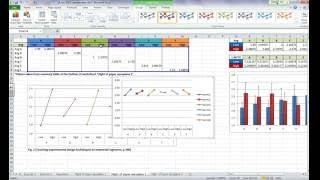
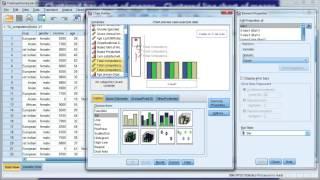
Create a chart of means for multiple groups on one graph with error bars
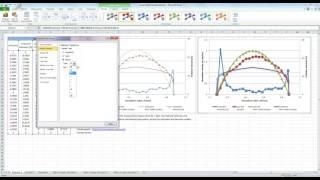
Format a series on a scatterplot in Excel
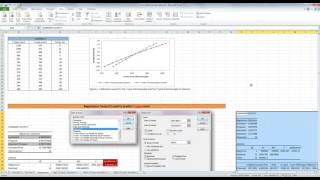
Regression in Excel using the Data Analysis Toolpak add-in
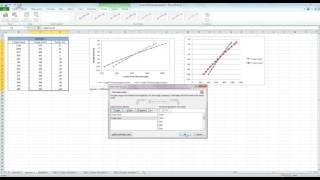
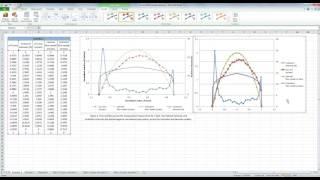
Scatterplot with 2 x-axis variables in Excel
Scatterplot with two y-axis in Excel
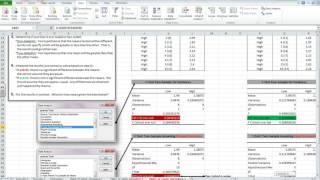
T-test and F-test in Excel using the Data Analysis Toolpak add-in
Excel Sort data compute average stdev SE and create a barline chart of means with error bars
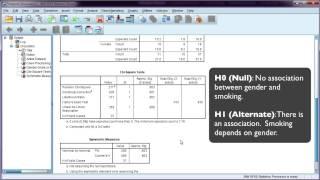
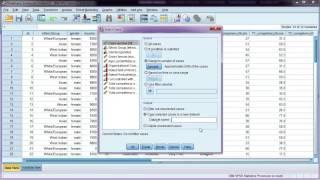
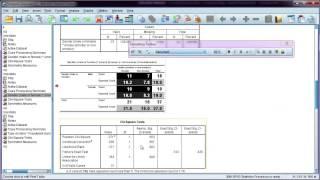
Chi-squared test and interpretation using SPSS assumptions violated
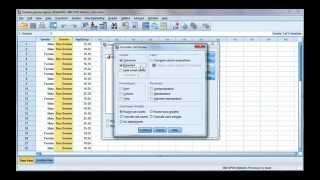
Change the coding of a variable using Recode into same variable in SPSS
Recode a scale variable into categories in SPSS
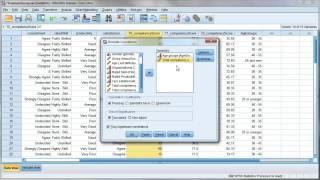
Reverse the coding of an ordinal variable in SPSS
Compute a total score from several variables in SPSS
Reduce the number of groups of a categorical variable in SPSS
Create dummy variables from an existing categorical variable in SPSS
Compute a mean score from several variables in SPSS
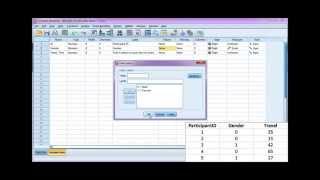
Questionnaire data in SPSS - Single response question
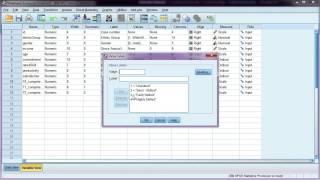
Enter data and define variables in SPSS
Import data from Excel into SPSS
Questionnaire data in SPSS - Open response question
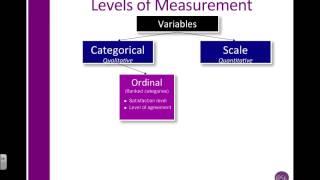
SPSS Understand Ordinal Nominal & Scale aka Level of measurment
Code and define missing values in SPSS
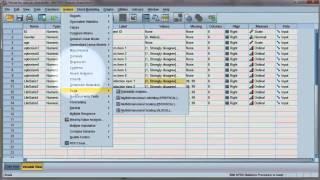
Questionnaire data in SPSS - Likert scale question
Questionnaire data in SPSS - Multi-response question
Questionnaire data in SPSS - Ranked response question
Compute z-scores for variables using SPSS
Repeated measures Clustered Bar or Line chart of means using SPSS optional error bars
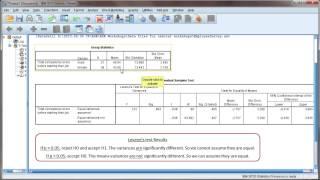
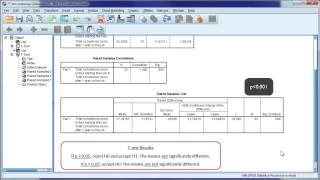
Interpret independent t-test output from SPSS
Paired t-test using SPSS
Independent t-test using SPSS
Interpret paired t-test output from SPSS
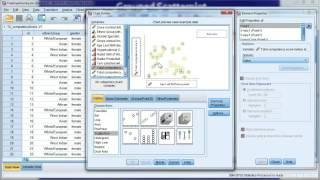
Scatterplot with trend line using SPSS
Repeated measures Bar or Line chart of means using SPSS optional error bars
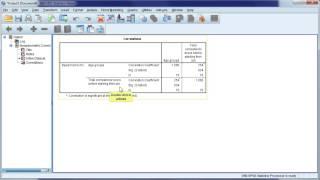
Pearsons r correlation using SPSS
Interpret Spearmans rho output from SPSS
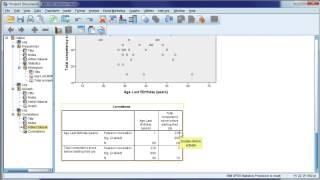
Interpret Pearsons r output from SPSS
Grouped scatterplot with trend lines using SPSS
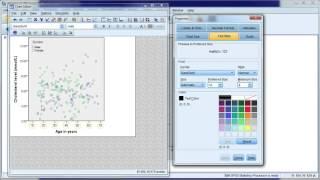
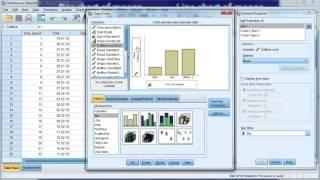
Edit a chart in an SPSS output file Ex 2
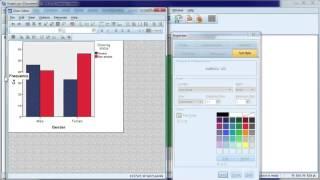
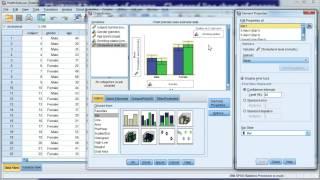
Edit a chart in an SPSS output file Ex 1 clustered bar chart
Chi-squared test + interpretation in SPSS assumptions not violated
Spearmans rho correlation using SPSS
Clustered Bar or Line chart of means using SPSS optional error bars
Bar or Line chart of means using SPSS optional error bars
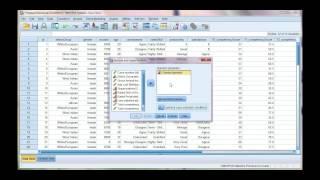
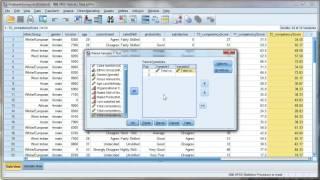
Select a random sample from your dataset to analyse in SPSS
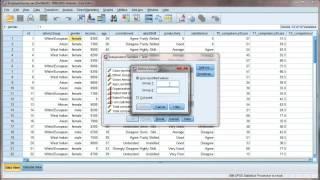
Analyse specific cases of data in SPSS
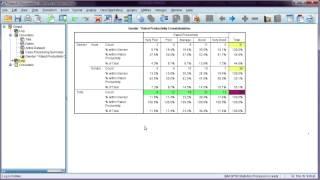
Interpret row column and total percentages in a crosstab table in SPSS
Use split file in SPSS to analyse groups separately
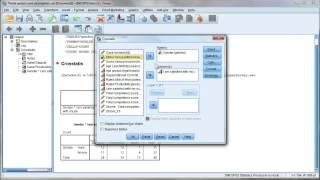
Create crosstab tables using SPSS
Format tables in SPSS output file
Reliability test Interpret Cronbachs alpha output in SPSS
Reliability test Compute Cronbachs alpha using SPSS